How to build a value performance scoring system for your CS portfolio
If your health score can't tell a customer what to do differently, what is it actually for?
Many CS health scores measure activity. Logged in recently? Green. Submitted a support ticket? Yellow. Haven’t touched the platform in 45 days? Red. These signals are easy to capture, reasonably easy to automate, and almost completely useless when a CSM sits down with a customer and tries to have a productive conversation about why they aren’t getting more value out of the platform.
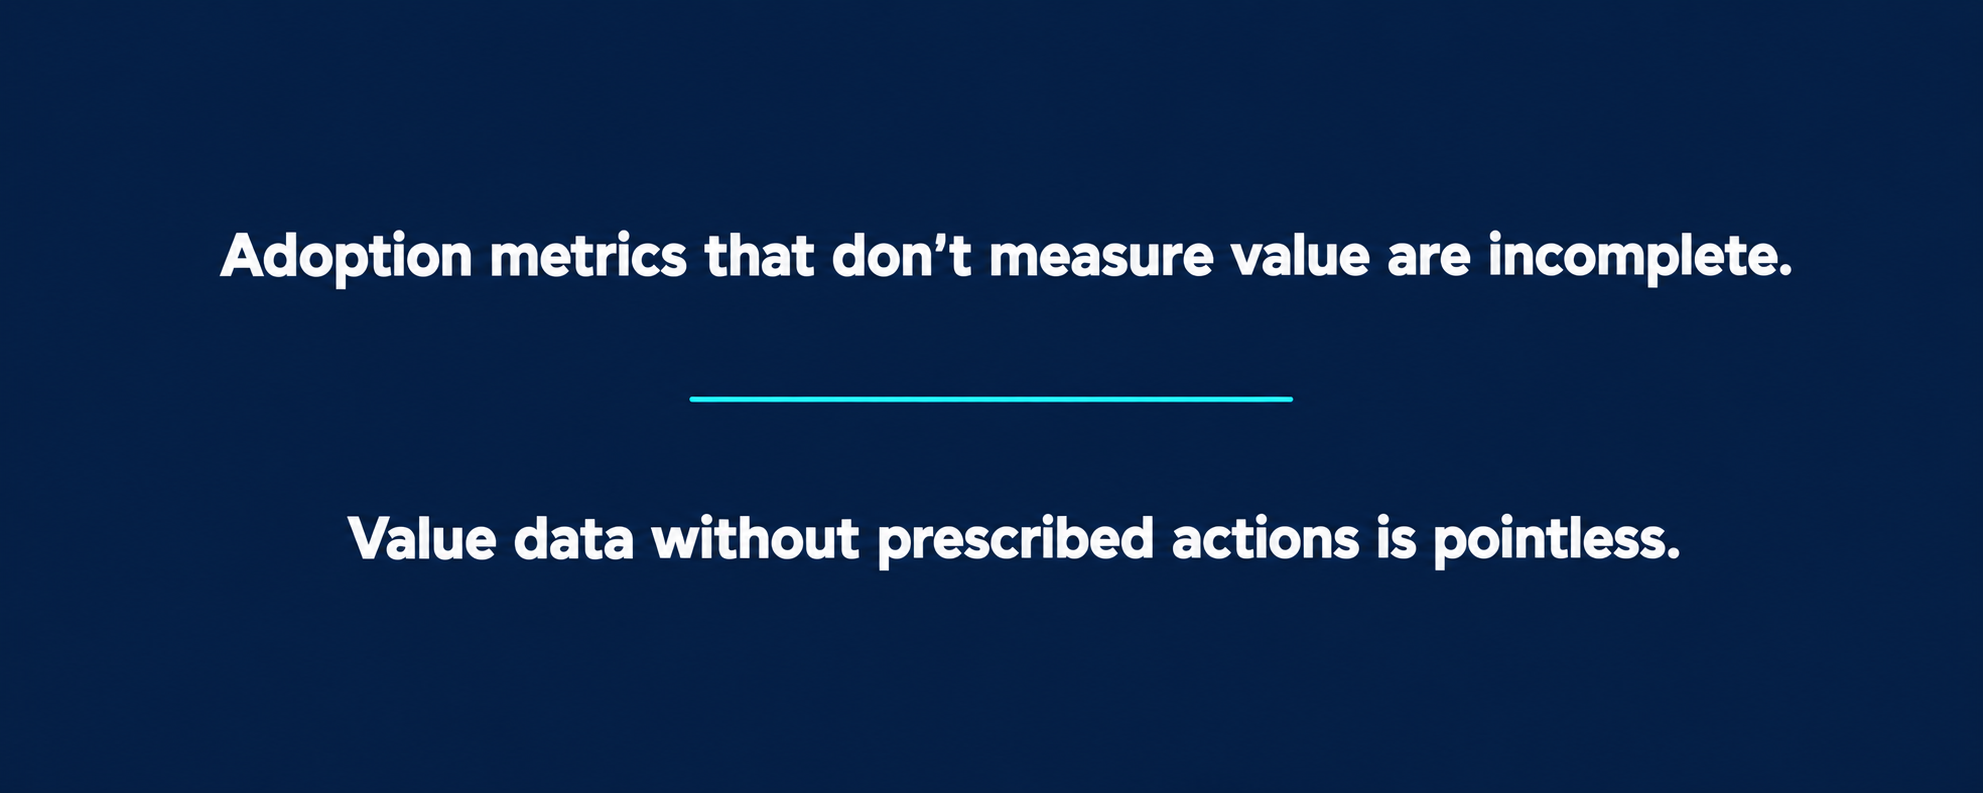
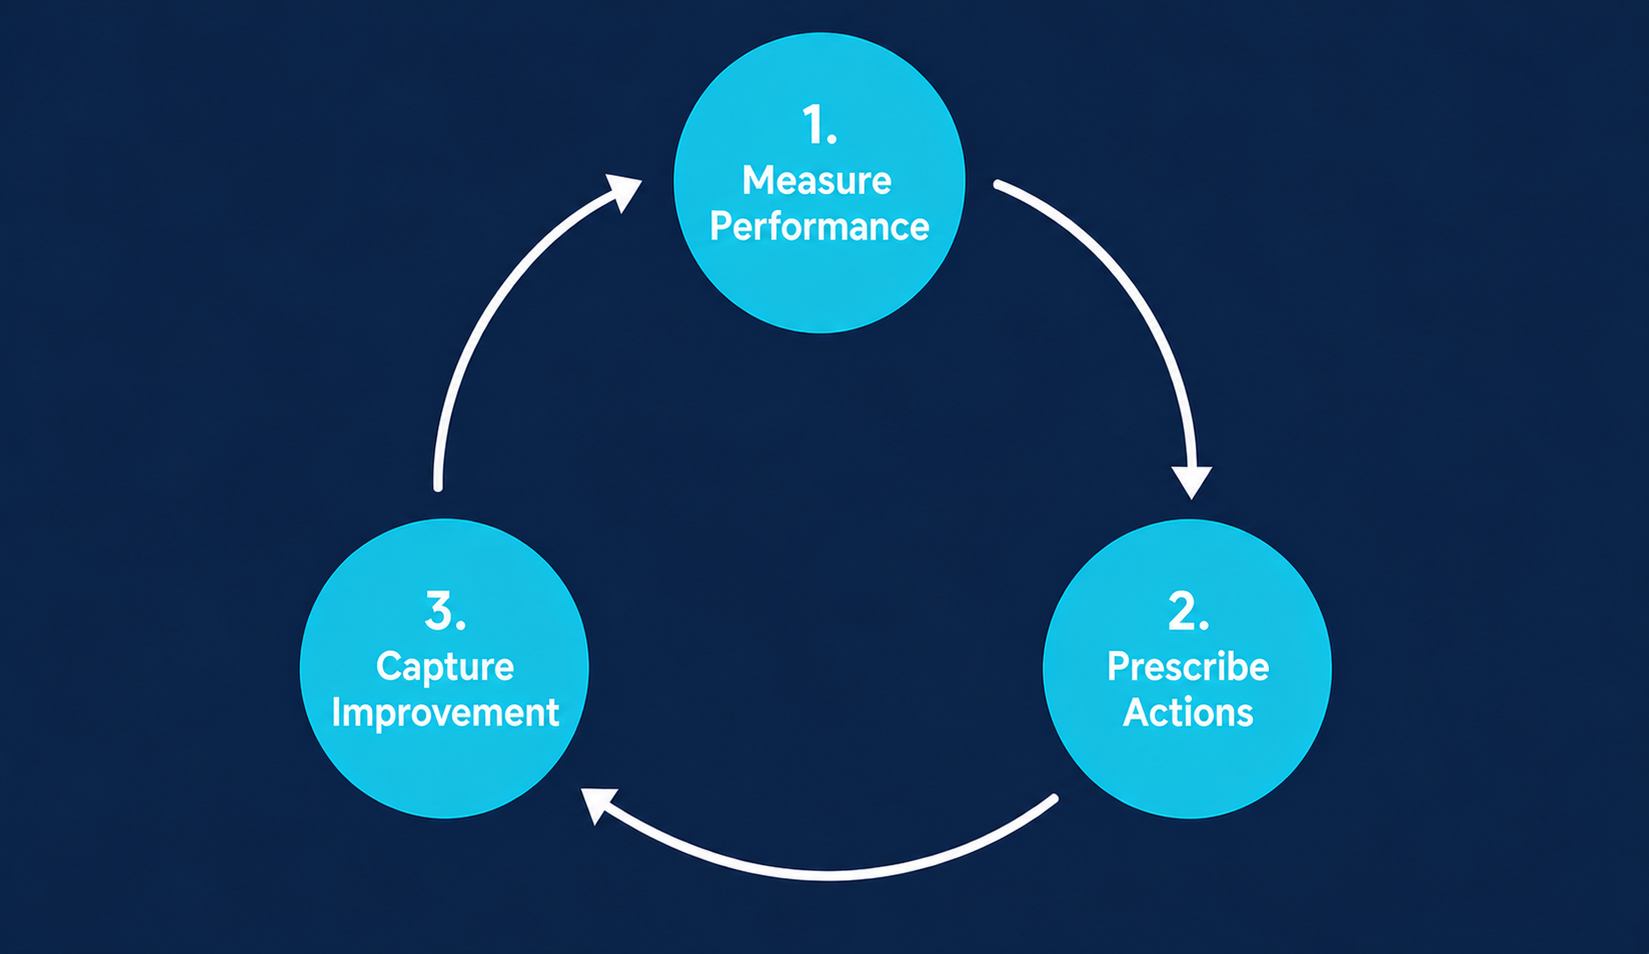
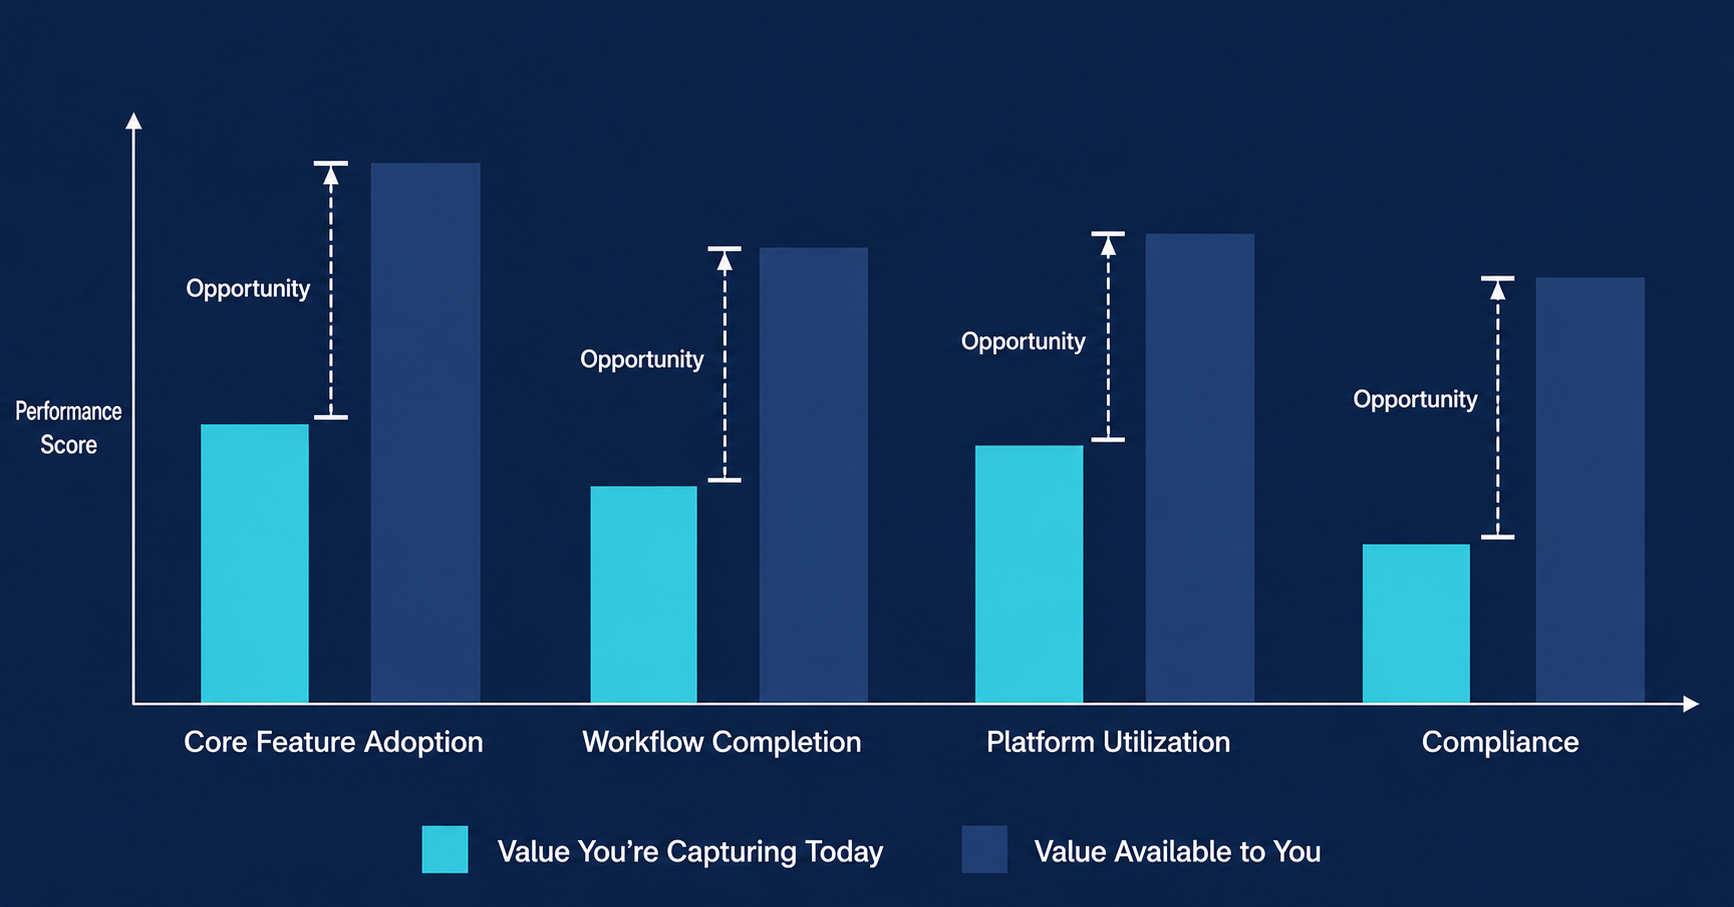
A value performance scoring system does something different. It measures outcomes: what customers are actually achieving with your platform and where they’re leaving value on the table. Most importantly, it includes specific, prescriptive actions customers can take to improve their performance to capture that additional value. Once it’s live, it runs on a simple cycle: Measure, Prescribe, Improve.
Here’s how to build one using a repeatable process that can be applied to other data-driven scoring systems as well.
Phase 1: Build the Model
Start with behaviors, not data
SaaS companies have more information at their disposal than ever before, so it can be tempting when building a data-driven score to start with…well, the data. But focusing on what you can measure before determining why you should measure can result in a scoring system that surfaces signals that aren’t truly meaningful or actionable. Instead, start with value.
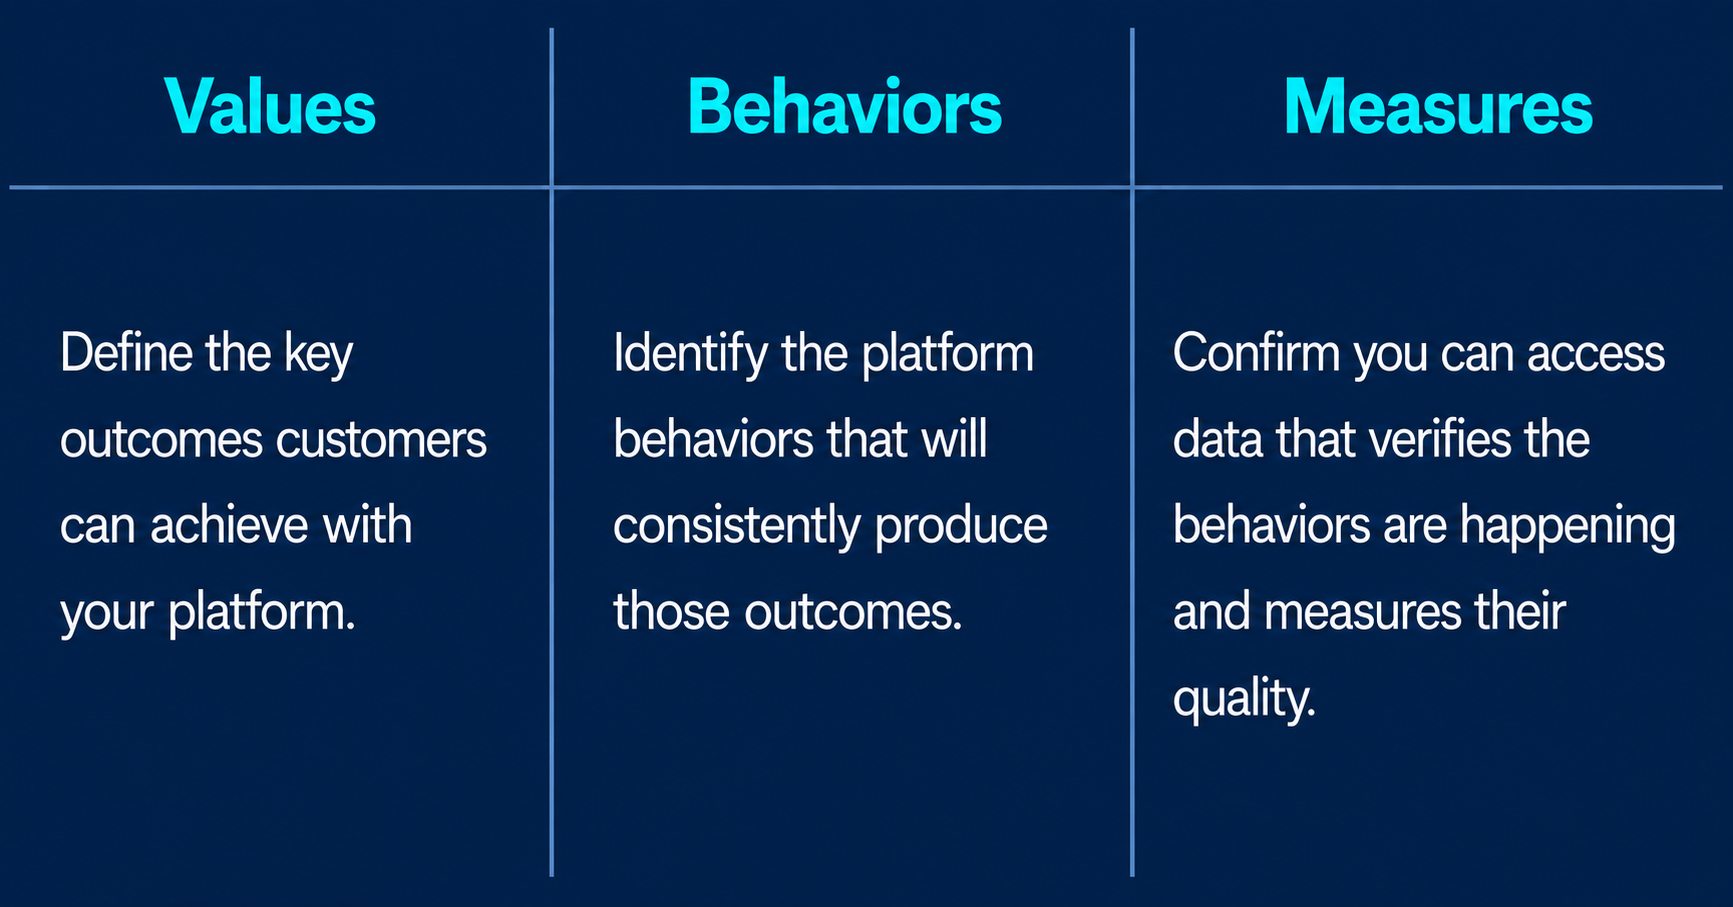
Map out the key outcomes customers can achieve with your platform. Go beyond the core value propositions your sales team uses to build business cases with new prospects. What are all the levers a customer can pull to generate meaningful outcomes? Some will be obvious. Others will surface only when you talk to your best customers and ask them what they’re actually using the platform to accomplish.
Once you have your value statements, map each one to the platform behaviors required to achieve the value. This could be a percentage of platform activities that successfully occur on a weekly or monthly cadence, or a sum of activities that, when combined, produce a specific result. It could be utilization of available API integrations or platform activities that maintain data cleanliness or integrity. These behaviors become your measures: is the customer doing what they need to do in the platform to achieve value, and how well are they doing it?
Document everything because you’ll need it in the peer review step coming up next. As you document each measure, include an initial weighting that reflects how much you believe it contributes to overall customer value. Your data architect will use these weights to build the scoring model. These don’t need to be precise at this stage but should be directional enough so that your SMEs can understand your thinking during their peer review.
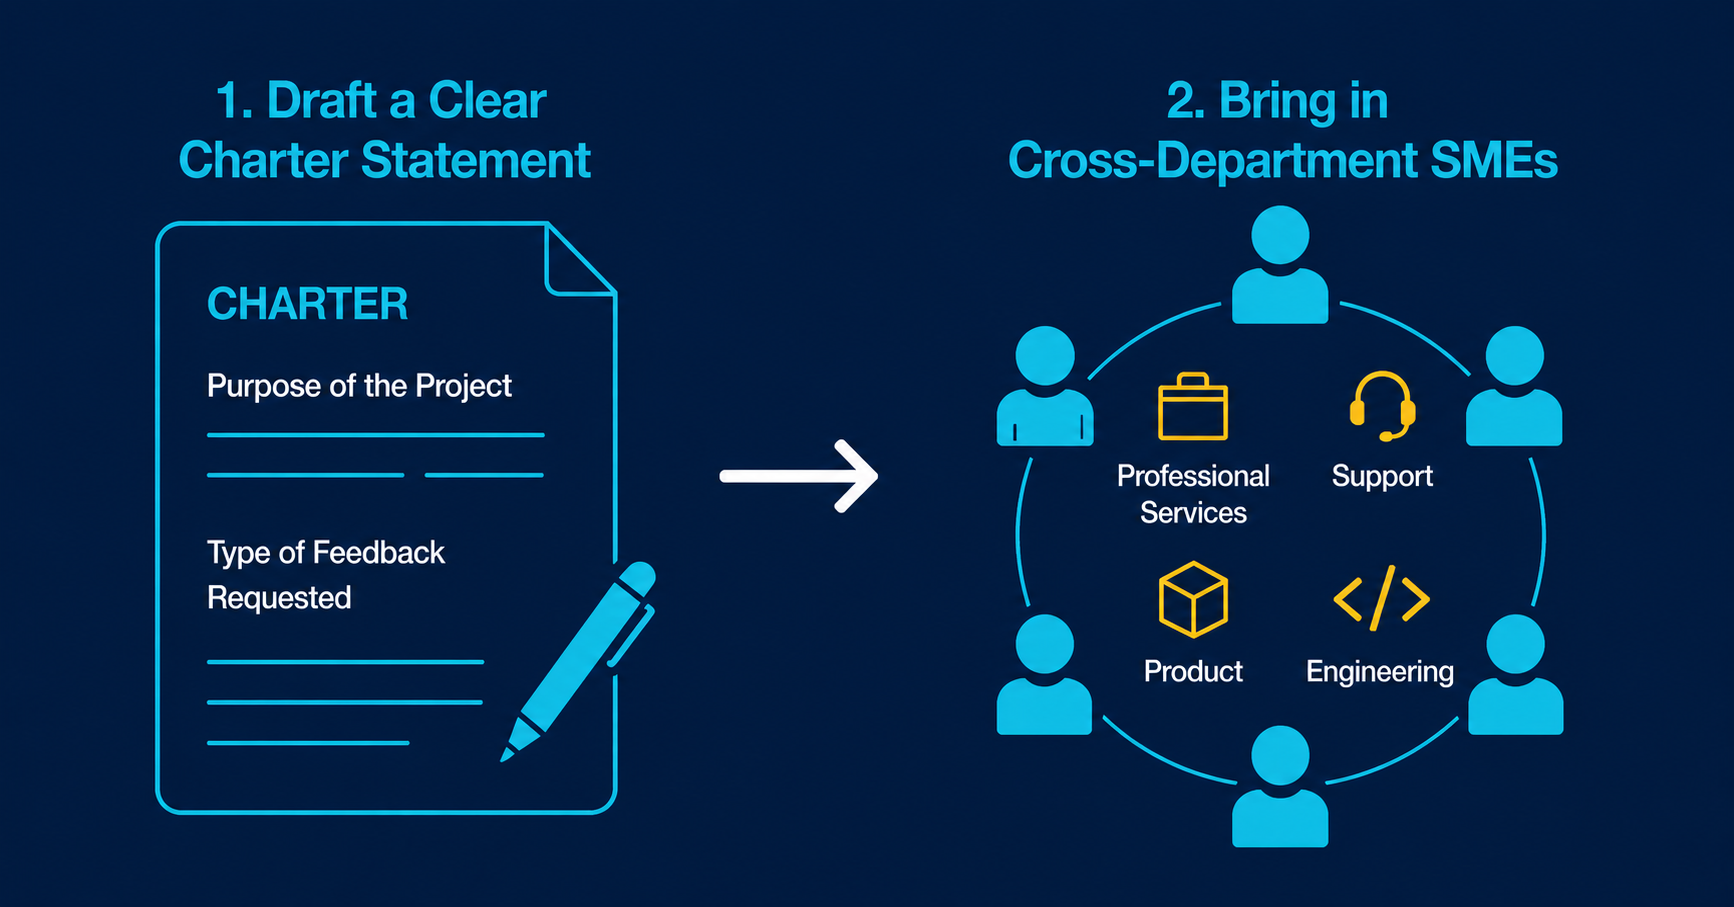
Before moving to data feasibility, you want to make sure your value positions are solid by incorporating some form of peer review. Draft a clear charter statement that defines the purpose of the project and the specific type of review and feedback you’re asking for. Then bring in your cross-department SMEs to interrogate what you have so far. Professional services, support, product, and engineering all have perspectives on platform behavior that your CS team doesn’t. Use their expertise to find holes in your positions, challenge your value statements, and pressure-test the weighting you’ve attached to each measure. A good SME group will also surface values and measures you haven’t considered. Depending on the size of your group and specific expertise of each person, you may need to establish several smaller groups that focus on specific areas of your scoring system. I’ve found that circulating the documentation one week before the session, not two, works best. Whereas one week creates a sense of calendar urgency, two weeks gives just enough time for the request to drift to the bottom of a personal to-do list and get forgotten.
After the session, reconvene your core team, decide what feedback to incorporate, update your documentation, and share the revised version with the larger group.
If you’re able to connect an AI agent to your platform data, you can bring AI into the process as another SME. Start by identifying the cohort of customers you know have successfully achieved one or more of the core values you previously identified. Load your value and behavior documentation into the agent for context, then have it assess that cohort to validate whether those customers are performing the behaviors you mapped to each value, and to surface any additional behaviors you may have missed.
To get more out of this exercise, give the agent access to other relevant contextual data alongside behavioral data. For example, any available trending data relative to license or location count, health signals, support ticket volume, and similar signals. This enables the agent to distinguish what high performers do differently, not just what all customers do. Without this additional context, you’re describing behavior. With it, you’re identifying the behaviors that actually drive results.
You can also have the agent analyze customers who churned against those who renewed successfully. That comparison often surfaces predictive signals your human team hasn’t flagged as high-leverage, and can strengthen your set of measures before you ever get to data feasibility. Remember to anonymize your data set so you’re not feeding proprietary or sensitive company or customer information into AI.
The data feasibility investigation
Now it’s time to dig into the actual data tables to confirm the feasibility of capturing data for what we want to measure.
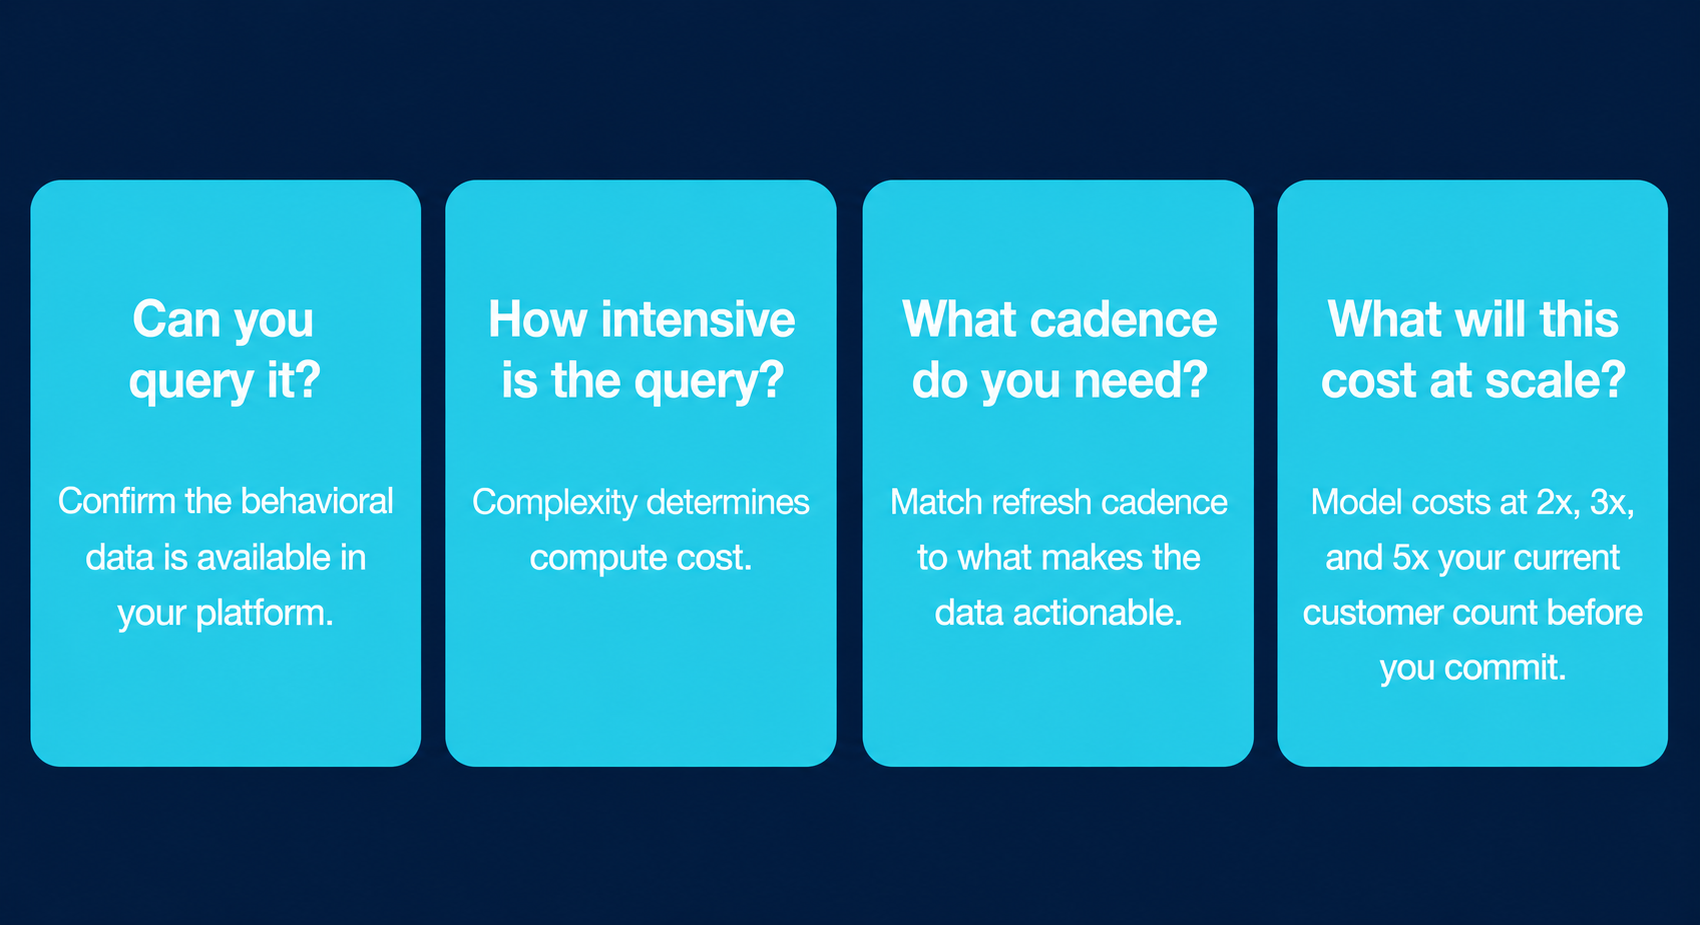
For each measure, work through four questions:
Can you query the data at all? Some of what you want to measure may not be available in your data tables the way you assumed.
How intensive is the query? Some measures are a simple row count. Others require joining multiple tables, applying conditional logic, or running aggregations across large data sets. The complexity of the query determines the compute cost.
What cadence do you need? A measure that needs to refresh daily can be meaningfully more expensive than one that refreshes weekly. Make sure the cadence you’re designing for is the cadence that actually makes the data actionable.
What will this cost at scale? Skipping this question can doom your scoring system down the line. You know your current customer count. You have growth projections. Model the compute costs at 2x, 3x, and 5x your current scale before you commit to a measure. Some measures that look affordable today become cost-prohibitive at scale.
This investigation will produce three general outcomes for any given measure. First: you can capture the data as designed, at a cost that works at scale. Build it. Second: you can’t capture the exact data, but there’s an acceptable proxy. Rewrite the measure around what you can actually capture. Third: the data exists but it’s too intensive to query it or the cost doesn’t work when you scale it. Cut the measure, or park it until the technology makes it feasible.
Document every decision and the reasoning behind it. When someone asks in 18 months why a particular measure isn’t in the model, you want a record of whether it was a deliberate cost decision or an oversight.
If you don’t have a dedicated data architect, AI tools can help you write queries and model compute costs. The quality of output depends heavily on how precisely you can describe the data you’re trying to pull, which is exactly why the behavioral documentation from the previous step matters. AI tools can also help you evaluate whether a different data architecture approach, such as pre-aggregated summary tables versus live queries, would meaningfully reduce compute costs at scale.
Build the data architecture and identify the action items
Once you’ve confirmed data feasibility, you’re ready to do the heavy lifting work: building the data architecture and identifying and writing the prescriptive action items customers should take to improve their results. The good news is you can run these two workstreams in parallel.
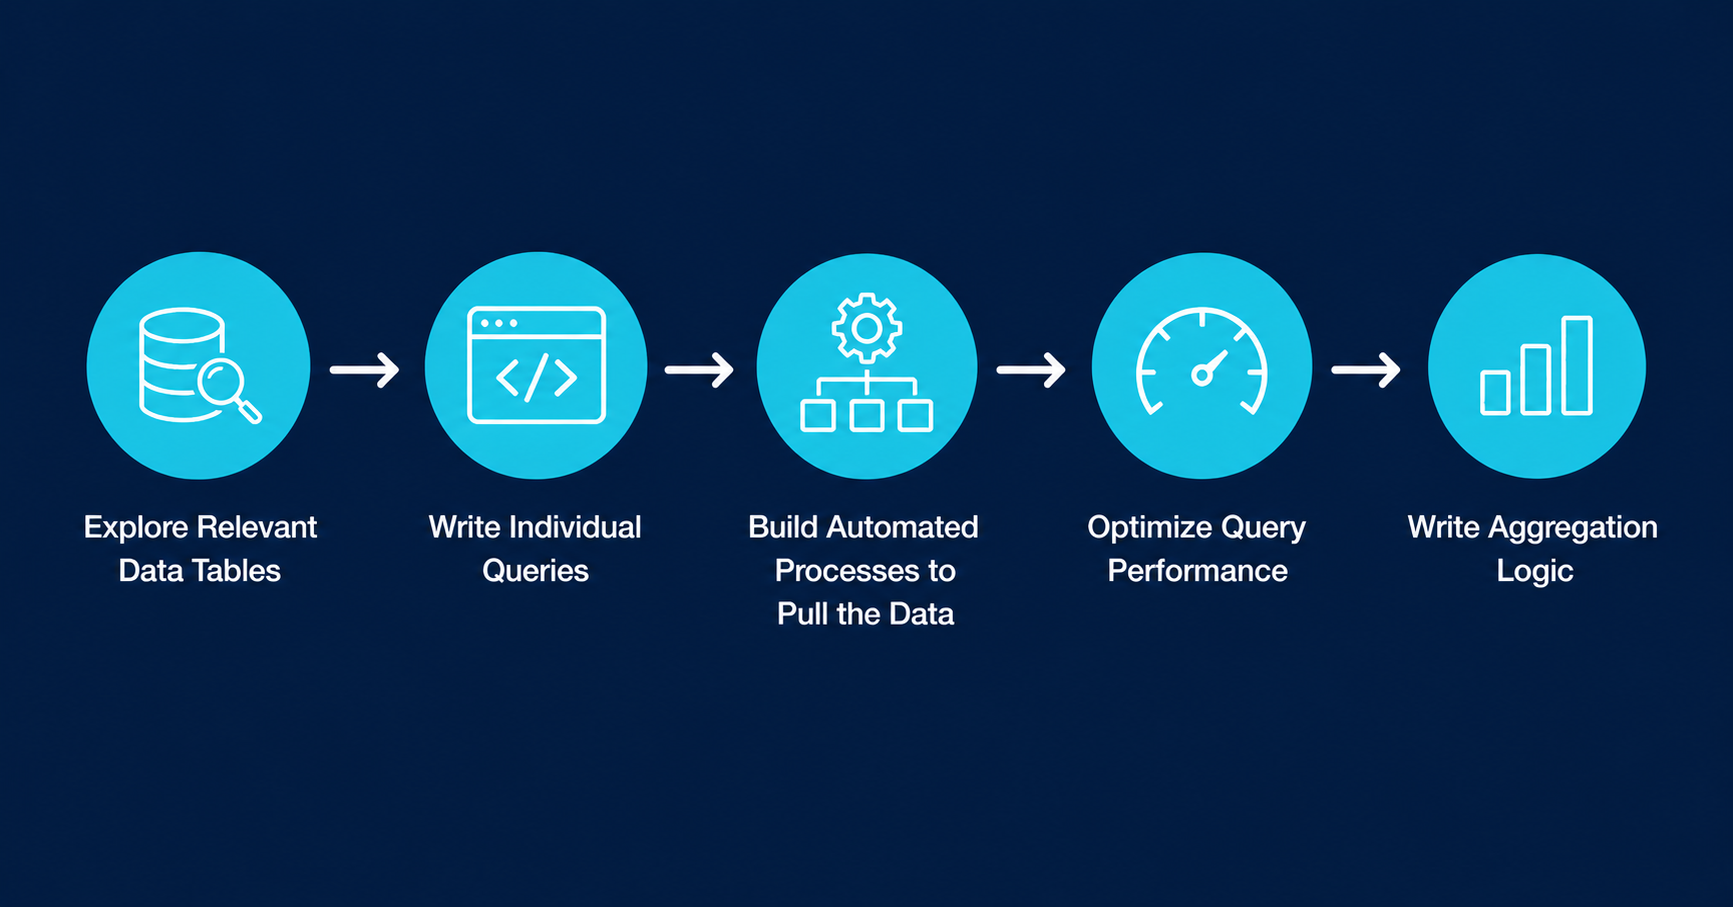
Data architecture. Your data architect explores the relevant tables, writes individual queries for each measure, and builds automated processes to pull the data on the cadence you’ve defined. Query optimization comes next: a query that returns in two seconds against your current data set may time out against a data set three times the size. Test for that now.
The aggregation logic is where the model takes shape. You want scores at the measure level, the category level, and the account level, so a CSM can see both the overall picture and the specific contributing factors. If your customers operate across multiple locations, you also want scores at the location level, so you can identify top and bottom performers within a single account.
Once the queries and logic are written, get them peer reviewed by your engineering team for two specific checks: data integrity (are we pulling what we think we’re pulling?) and platform impact (are we hitting the same data tables your customers use, and at what cost?). If any of your scoring queries compete with your customers for database resources, you’ll want engineering’s sign off on that before you go live.
At this stage, it can be tempting to begin visualizing your data in a BI tool but I’ve found that starting simpler is better as it allows you to interrogate your data before investing time in how it is rendered. Have your data expert port the initial results into a Google Sheet or Excel file so you can look at all customers side by side, sanity-check the scores against your existing knowledge of the portfolio, and catch anything that looks wrong. A customer you know is struggling should not show up in the top quartile. If they are, the most probable cause is an issue with the query logic, but you should also dig deeper to make sure you didn’t miss something in how your values and behaviors are mapped.
Once you have initial scores in the sheet, review the weighting and scoring calculations against what you know about your portfolio. Adjust from there. A word of caution on complexity: you should expect your customers to ask questions about how the scores are derived so your model has to be easily explainable and can’t require a statistics degree to comprehend. Your target is something a CSM can credibly explain in two sentences that any customer can follow.
Action items. A scoring system without prescriptive actions is a report card. And your goal isn’t to hand out grades but rather to help your customers get better.
For every measure in your model, document a specific set of actions the customer can take to improve their performance. Not general guidance. Specific steps, in sequence, with the rationale for why each step drives improvement on that measure. Why does this matter? How does it help? What exactly should the customer do?
The action items are the main character of the entire scoring system. They create a shared “improvement agenda” and have the power to transform the entire CSM-Customer dynamic from one that is primarily relationship-driven to one that is balanced between your CSM’s relationship superpowers and a structured program of systematic improvement.
The score is what gets the customer’s attention in the room. The action items are what they leave with. They become a key component of the regular customer touchpoints and provide a measurable paper trail of the new value the customer has captured throughout the year.
Data without recommended actions is reporting.
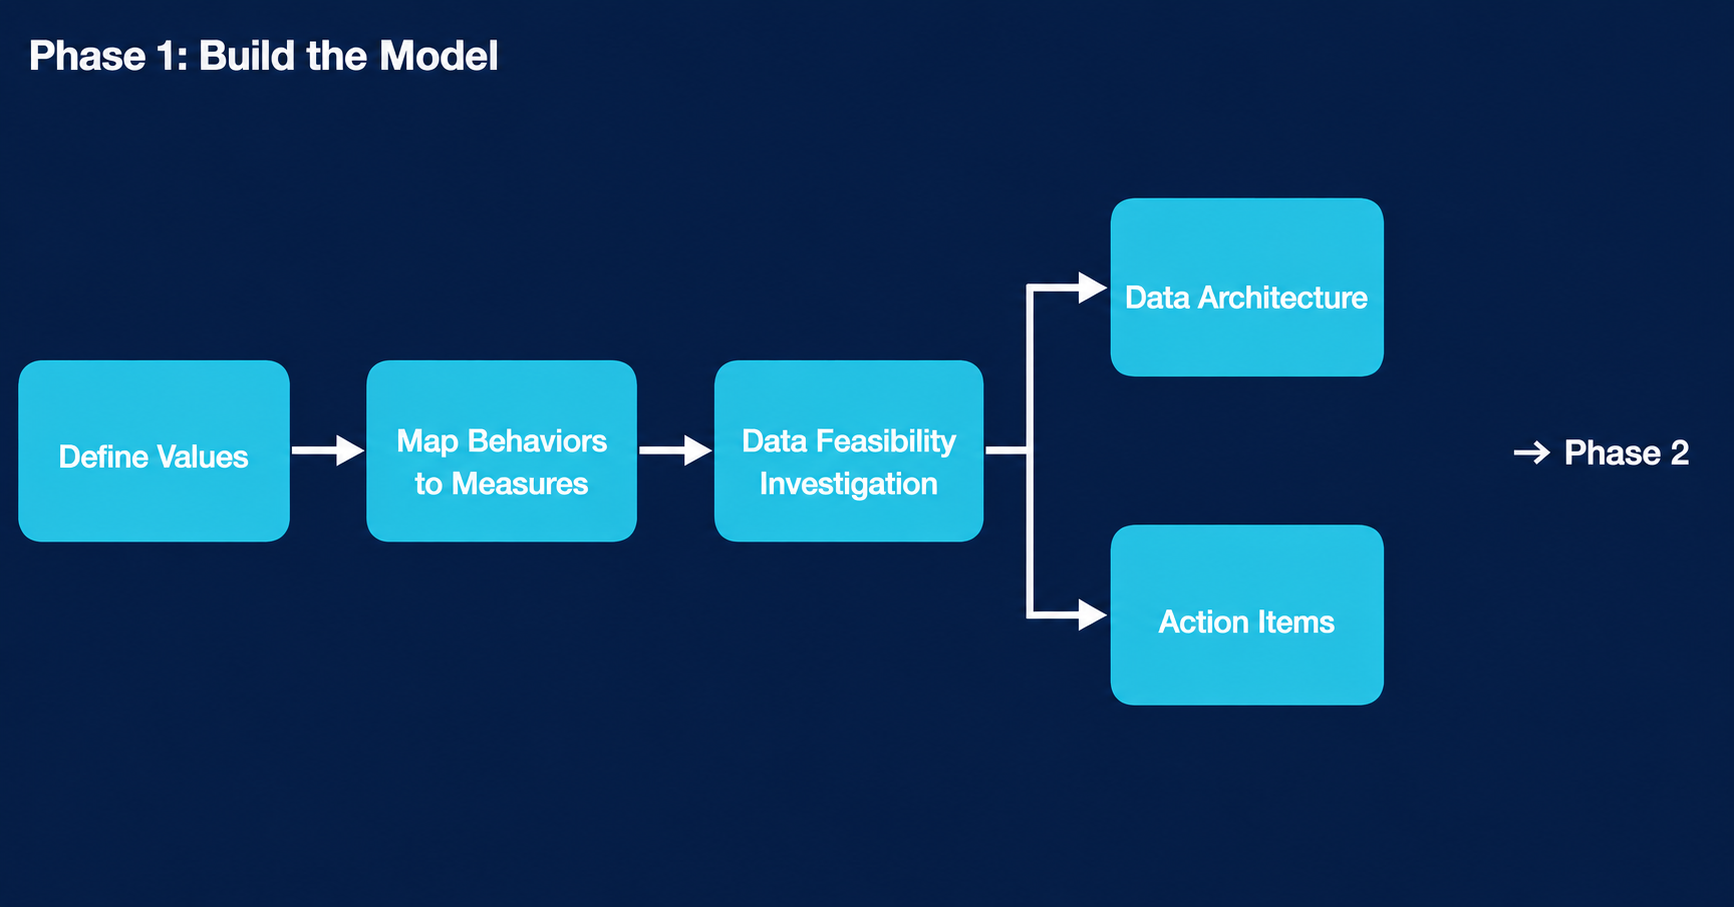
How Phase 1 flows
Here’s how the Phase 1 steps connect before we move into the pilot.
Phase 2: Pilot
Develop the customer presentation
Before you go to a single customer, spend time designing the conversation. How you present this system determines whether it lands as a partnership or a lecture.
The framing that worked for us was telling customers upfront that we’re intentionally hard graders. Our role in Customer Success isn’t to hand out automatic hi-fives but rather to be your guide, showing you exactly where you’re achieving value, exactly where you’re leaving it on the table, and the specific steps to capture it.
Structure the session in four movements.
Start with where the customer is winning. Acknowledge what’s working and celebrate the wins.
Then move into the performance gaps.
Be specific about what the gaps are costing them. “Adding this vendor integration could save X people hours over the course of a year” is a useful observation. “Your adoption score is low” is not.
Then show them the benchmarks. Are they on target or falling behind?
Bonus points if you’re able to show how your customer compares to their competitors in the same industry. That context often resonates more deeply than the score alone.
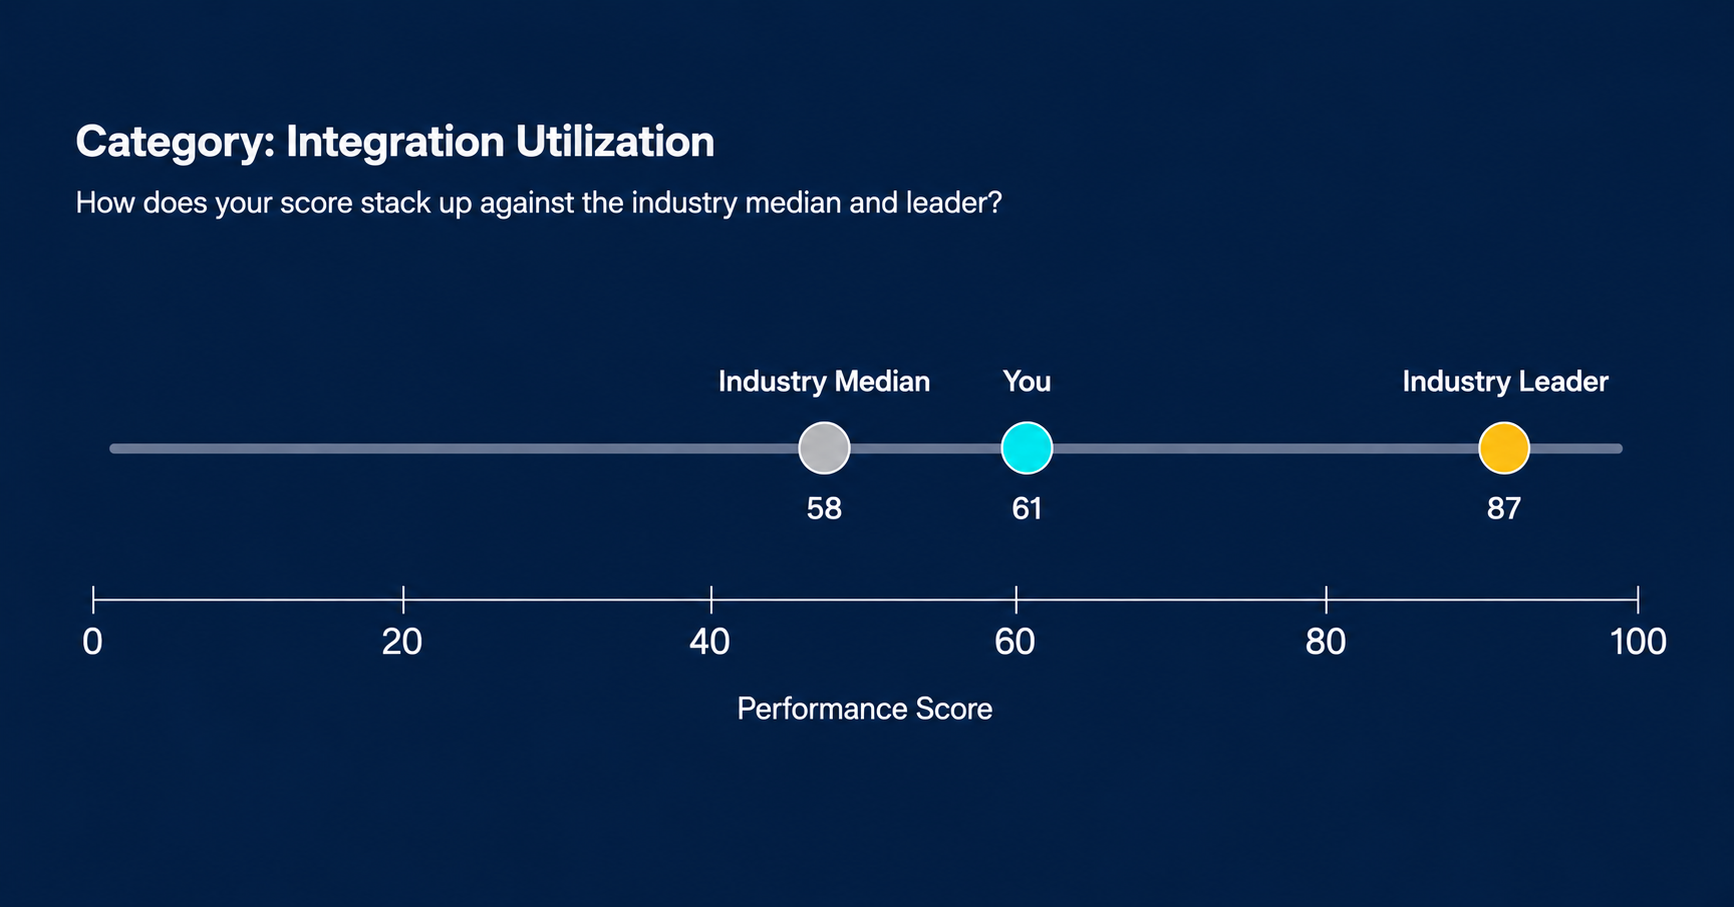
At Crunchtime, because we worked with a significant portion of the restaurant industry, we had enough customers in each segment to build meaningful industry comparisons. For a fast casual customer, we could show them the aggregate score of the industry leader in their segment, the segment median, and their direct competitive set, all anonymized. No customer names, no identifying information. Just the scores. That context changed the conversation entirely. A customer who thinks they’re performing well relative to their own baseline often reacts very differently when they see where they stand relative to the segment leader.
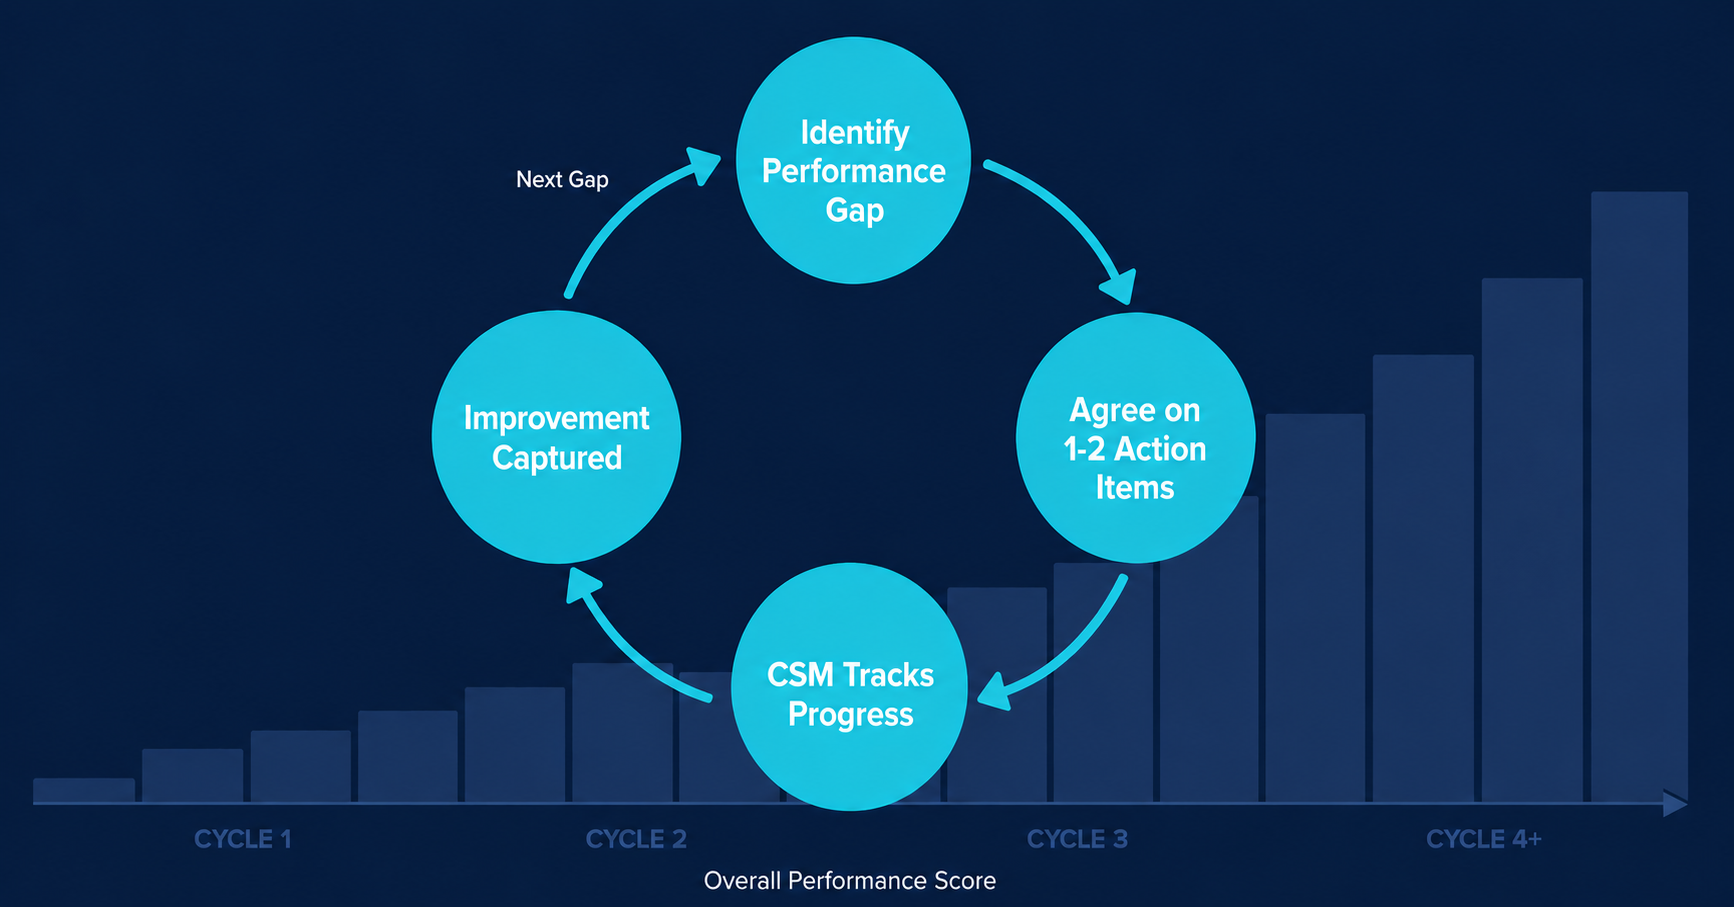
Finish with the menu of prescribed actions to identify the specific actions that make the most sense for the customer to start with. The outcome you’re trying to achieve is agreement on one to two action items to work on before the next meeting. Not a list of twelve things. One or two. The CSM tracks progress on those specific items in every subsequent touchpoint. When meaningful progress is made, you identify the next one or two. This rhythm reinforces something important: the customer owns the platform. Your CSM can show them where the value is. They have to go get it.
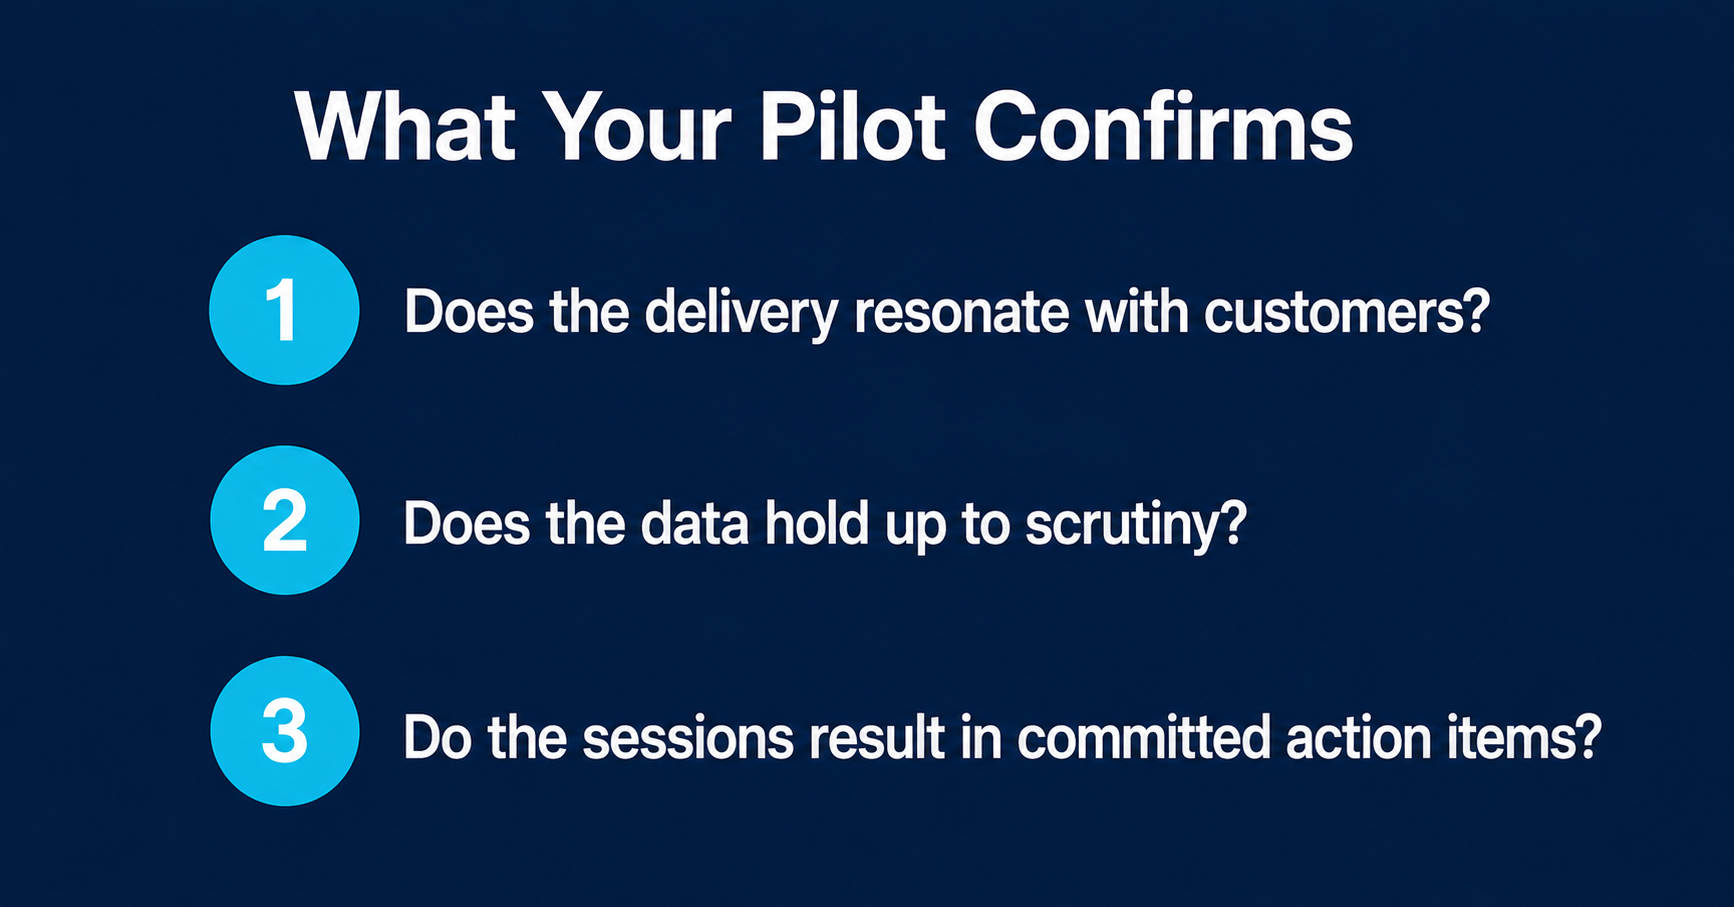
Select pilot customers and call MVP
Now it’s time to run a quick pilot and gather feedback before calling your system finished. Run several initial sessions with a small group of customers you trust to engage critically and give you honest feedback. You’re not looking for your easiest customers. You’re looking for the ones who will tell you when something isn’t landing.
After running your pilot sessions, you have qualitative feedback from multiple customers that needs to be synthesized into a coherent set of refinements. Feed your session notes into an AI model and ask it to identify recurring themes, flag objections that came up across multiple customers, and prioritize the refinements most likely to improve how the program lands. What would take an afternoon of manual synthesis takes minutes, and the output is more systematic than what most people produce by reading through notes sequentially.
Use the pilot feedback to refine the presentation, the benchmarks, and the action item documentation. It’s important to avoid “good” becoming the enemy of “great” here. Unless your initial sessions uncovered a critical issue, incorporate the feedback, call your MVP done, and move to Phase 3.
Enable the team
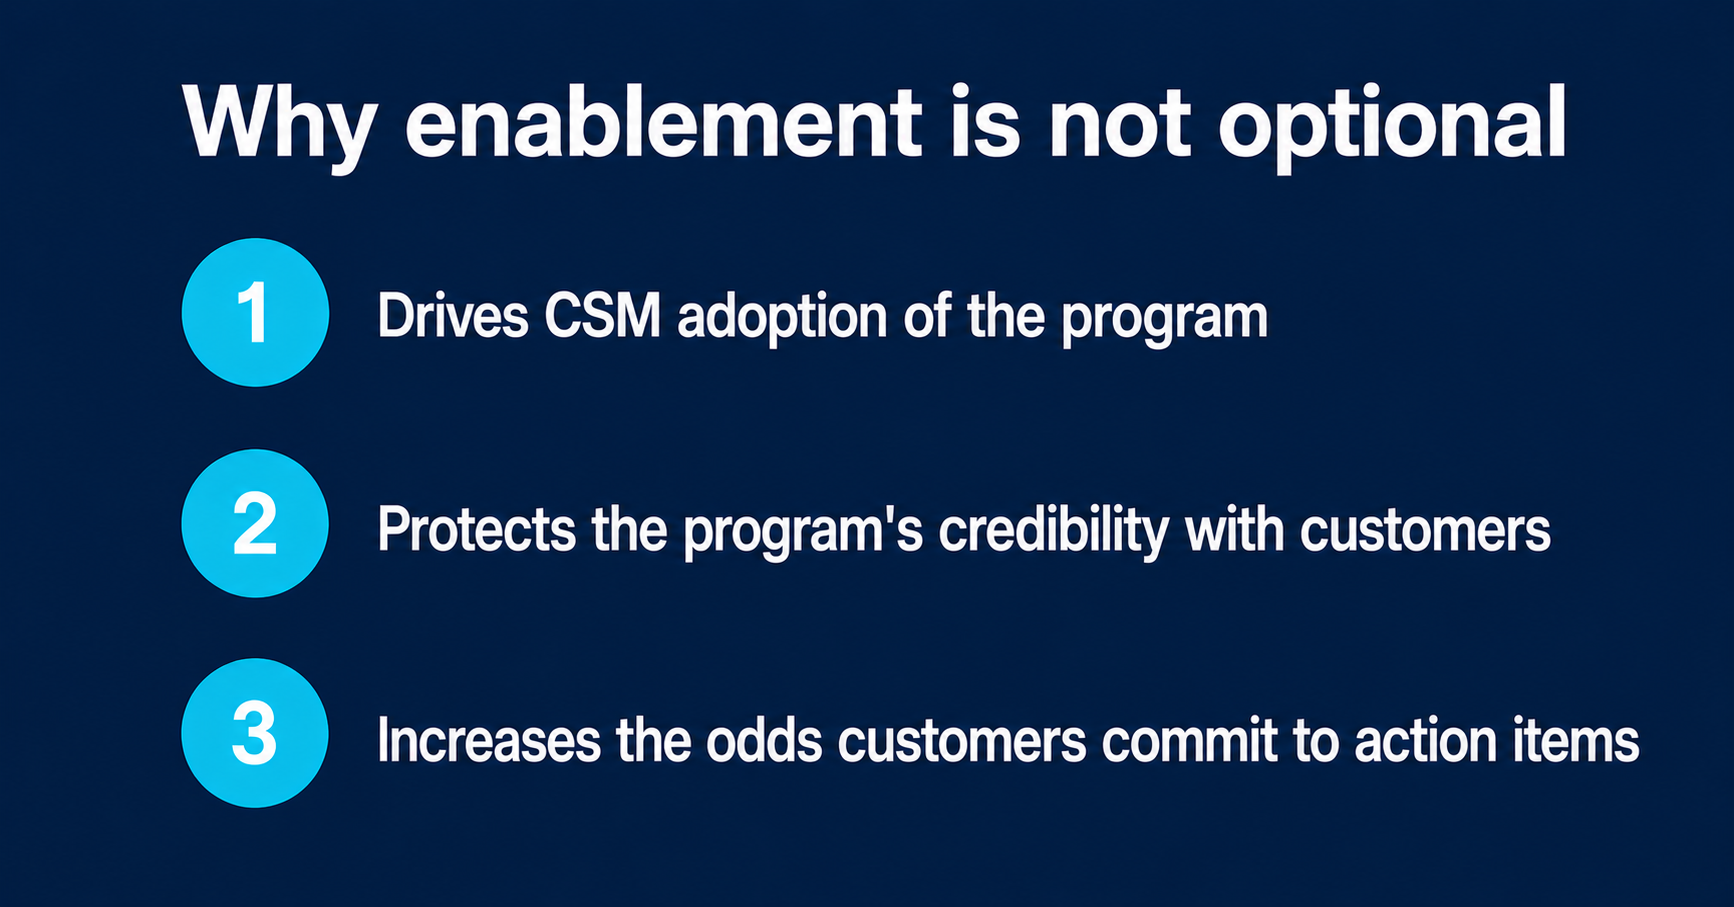
Sadly, team enablement is where a lot of great ideas get stuck and impede adoption. Your CSMs need to understand the scoring system deeply enough to explain the scores and action items on the fly and answer follow-up questions without losing credibility. That’s the bar. Train to it. Your output here should be training artifacts that live somewhere your team can easily find them, whether that’s an LMS, a wiki, or a shared drive, so your current team has a refresher resource and new hires can get up to speed without starting from scratch. Role playing exercises where CSMs can practice delivering scores to you and other team members playing a customer can be invaluable at this stage. Another approach that works well is establishing a weekly office hours cadence where CSMs can drop in and ask questions or listen in.
Build cheat sheets that document the rationale behind each measure, the benchmark ranges, and the action items for each gap scenario. These aren’t substitutes for training. They’re the reference material a CSM pulls up before walking into a session with a customer they haven’t worked with before.
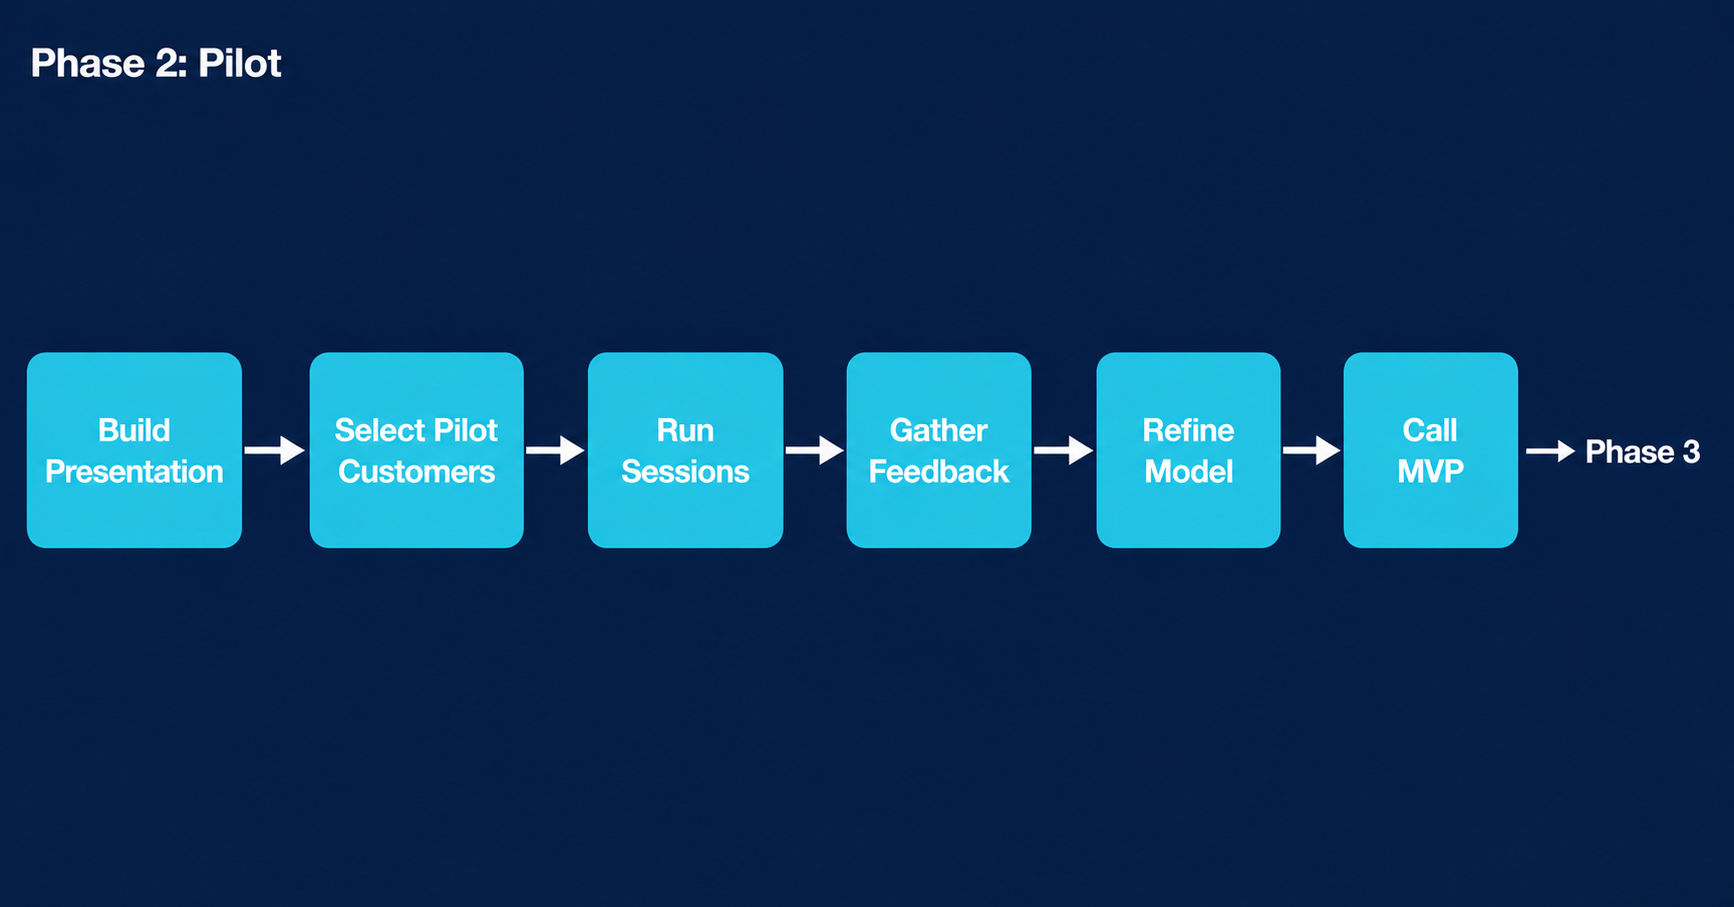
How Phase 2 flows
Here’s how the Phase 2 steps connect before we go live.
Phase 3: Go Live and Scale
Phase 3 runs on two tracks simultaneously: Go Live focuses on CSM adoption and coaching, while Scale builds the infrastructure that makes the program durable.
Go live
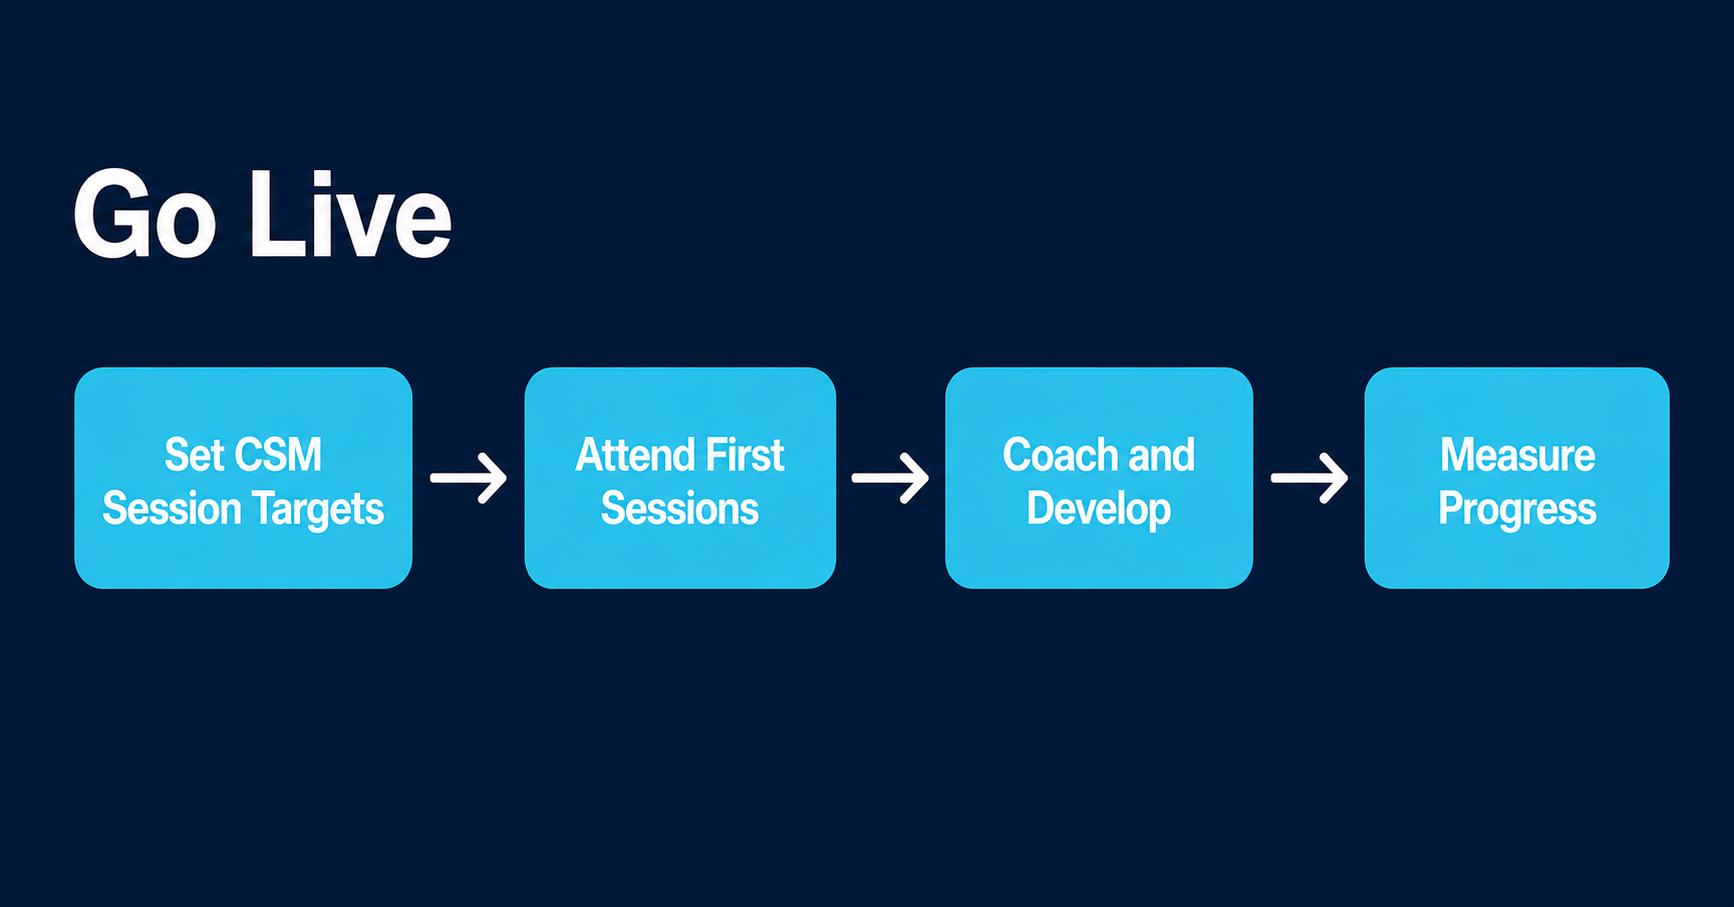
Just as data without interpretation and prescribed action is mostly meaningless, a program that isn’t used produces nothing. In addition to enablement, setting targets for how many customer sessions each CSM should complete and then tracking completion is the best way to ensure CSM adoption of the program. Targets should be calibrated to their book of business and spread over the next two months. Building muscle memory is key at this stage.
Attend each CSM’s first few customer sessions yourself. You’ll catch coaching opportunities you can’t identify from a debrief. You’ll also build credibility with customers when they see that CS leadership is invested enough in the program to show up.
Watch for the CSMs who struggle with the scoring conversation. Some will find it uncomfortable to tell a customer their scores are low. Coach directly to that discomfort. The scoring system only works if every CSM is willing to be honest with every customer. Selective honesty produces selective results.
Attending your CSMs’ first sessions gives you direct coaching material, but you can only be in one place at a time. If your CSMs are recording their sessions, an AI model can analyze the transcripts and flag coaching opportunities across multiple sessions simultaneously. Where is the CSM losing the customer’s attention? Are there customer questions the CSM could have answered better? Are there parts of the score delivery that are landing better than others? Patterns that would take weeks to surface through one-on-one debriefs become visible across the whole team in a single pass.
Scale
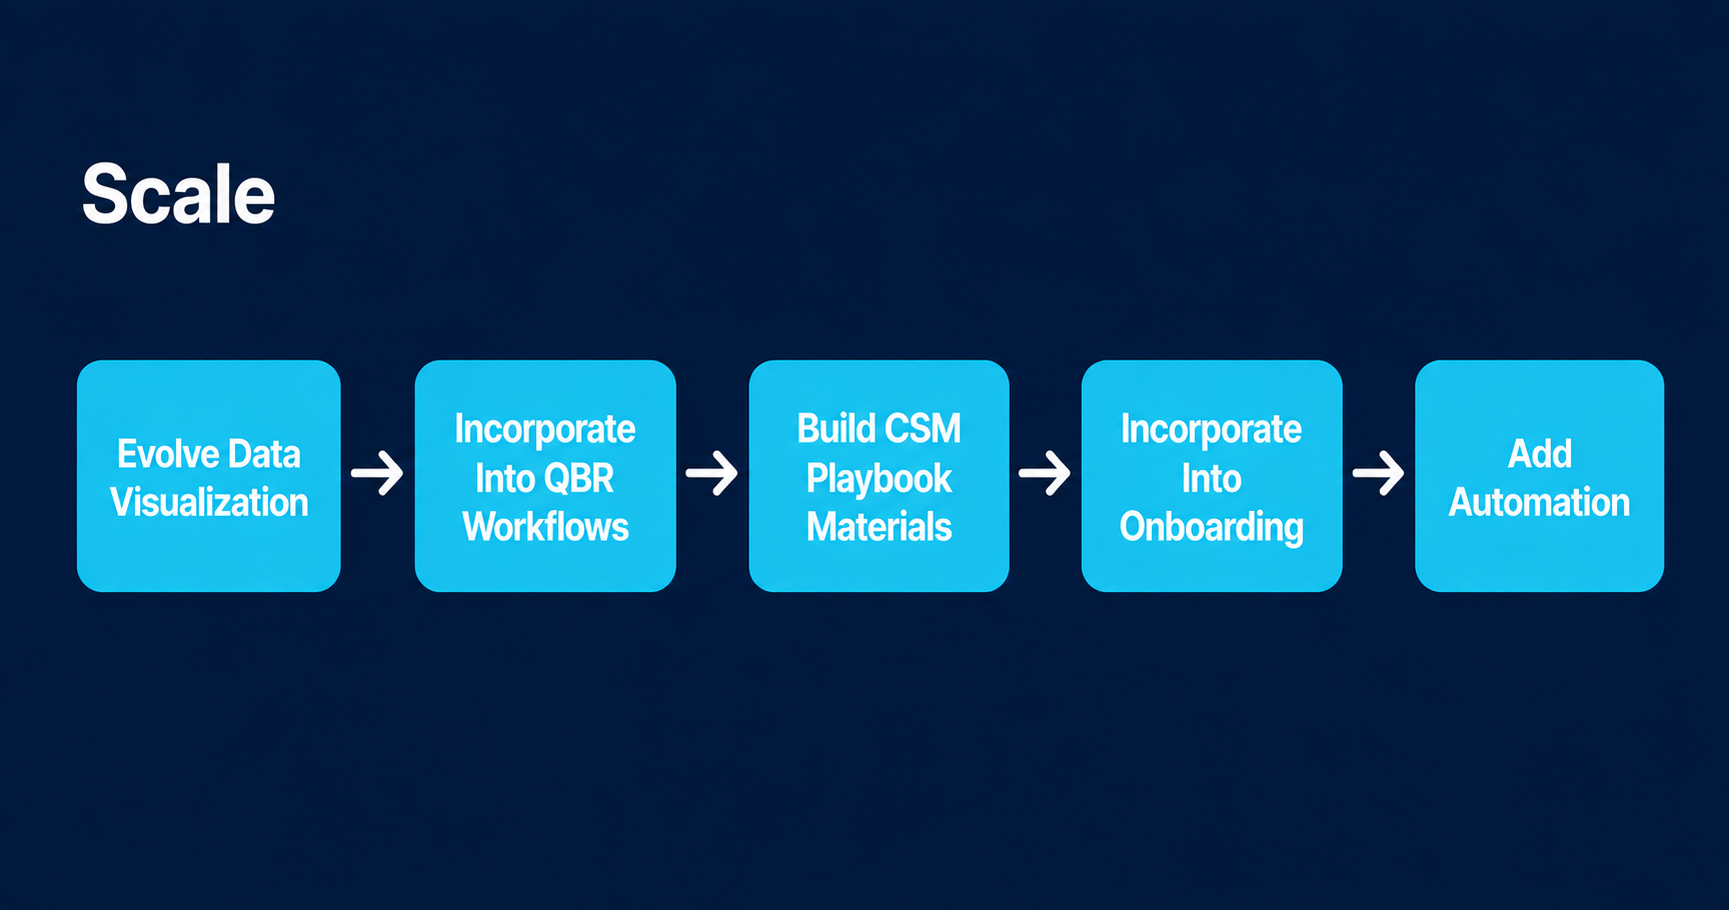
While your CSMs are running sessions, other members of your team should be working in parallel on the infrastructure that makes the program durable.
The Google Sheet that got you through MVP will not serve you at scale. Invest in a proper visualization layer. At Crunchtime, we moved from the initial Google Sheet to Sigma, which gave us trending data, portfolio-wide views that leadership could monitor, and a format we could eventually port into our CSP. Trending data is particularly valuable when it comes to predictive insights and proactive outreach.
Incorporate the scoring system into your QBR workflow. This is where the renewal conversation changes. When every QBR is anchored to performance scores, progress on action items, and a clear picture of value still available, you’re no longer preparing a retrospective. You’re running a forward-looking partnership session. C-suite engagement tends to follow.
Once your scoring data is structured, generating a first draft of each customer’s performance summary and recommended action items is a reasonable AI task. Give the model the customer’s current scores, any available trend data, and the benchmark context, and ask it to draft the QBR narrative and top three action item recommendations. Your CSM reviews, adjusts, and owns the final version. The AI handles the first pass on a task that otherwise takes 30-45 minutes per customer.
Build out your CSM playbook materials beyond the initial cheat sheets. The more your team can pull from a shared library of action items, benchmark context, and conversation guides, the more consistent the customer experience becomes across your book of business.
Incorporate the scoring system into your onboarding motion. New customers should understand from day one how their performance will be measured, what good looks like in their segment, and what the CSM will be working with them on throughout the relationship. Setting that expectation early changes the dynamic of every subsequent conversation.
Add automation where it reduces friction without removing judgment. Automated score refreshes, triggered alerts when a customer’s score drops below a threshold, and pre-built report templates for QBRs are all reasonable candidates. Automating the conversation itself is not.
Don’t forget your smaller customers. If part of your portfolio includes customers that don’t get a regular touchpoint, create a scaled down method for delivering a snapshot view of their scores and performance opportunities with corresponding recommendations via email.
What this produces
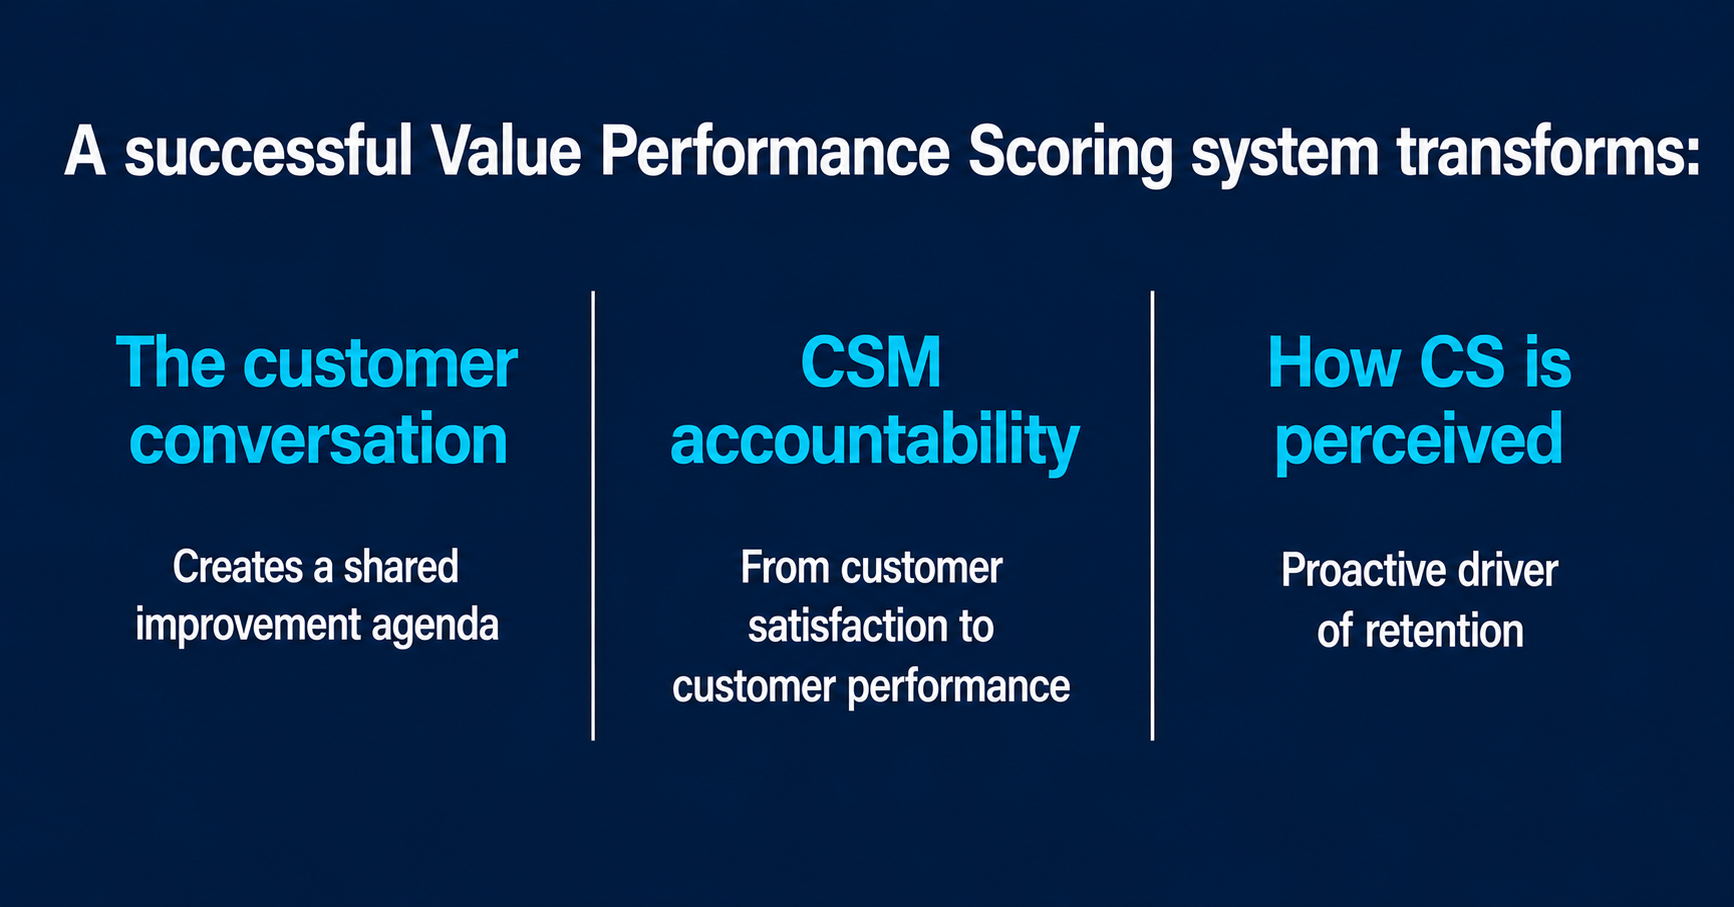
Done well, a value performance scoring system changes three things.
It changes the customer conversation. You’re no longer reporting on what happened. You’re prescribing what to do next, with the data to justify the recommendation. Customers who previously sat through QBRs out of obligation start showing up with their leadership because the session is actually useful.
It changes what your CSMs are accountable for. They’re not just responsible for relationship health. They’re responsible for customer performance. That’s a harder job and a more defensible one.
It changes how the organization thinks about CS. When you can show the CFO a portfolio view of customer performance scores alongside renewal risk and expansion opportunity, you’re speaking a language that Finance, Product, and Sales all understand. That’s what earns CS a seat at the table that doesn’t depend on who the CS leader knows.
This methodology applies to other scoring systems too. Identify the outcomes that matter and define why they’re impactful. Validate data feasibility and cost before building anything. Then identify the specific actions customers or internal teams should take based on what the data shows.
A future piece will cover how to add an AI reasoning layer on top of this foundation to identify patterns across your portfolio that aren’t visible at the individual account level.